



Unified Identity Visibility

See identities and access in one graph

Connect human and non-human identities, permissions, and resources across on-premises and cloud in one graph. See who can reach critical assets and understand the relationships that create identity exposure.

Identity graph
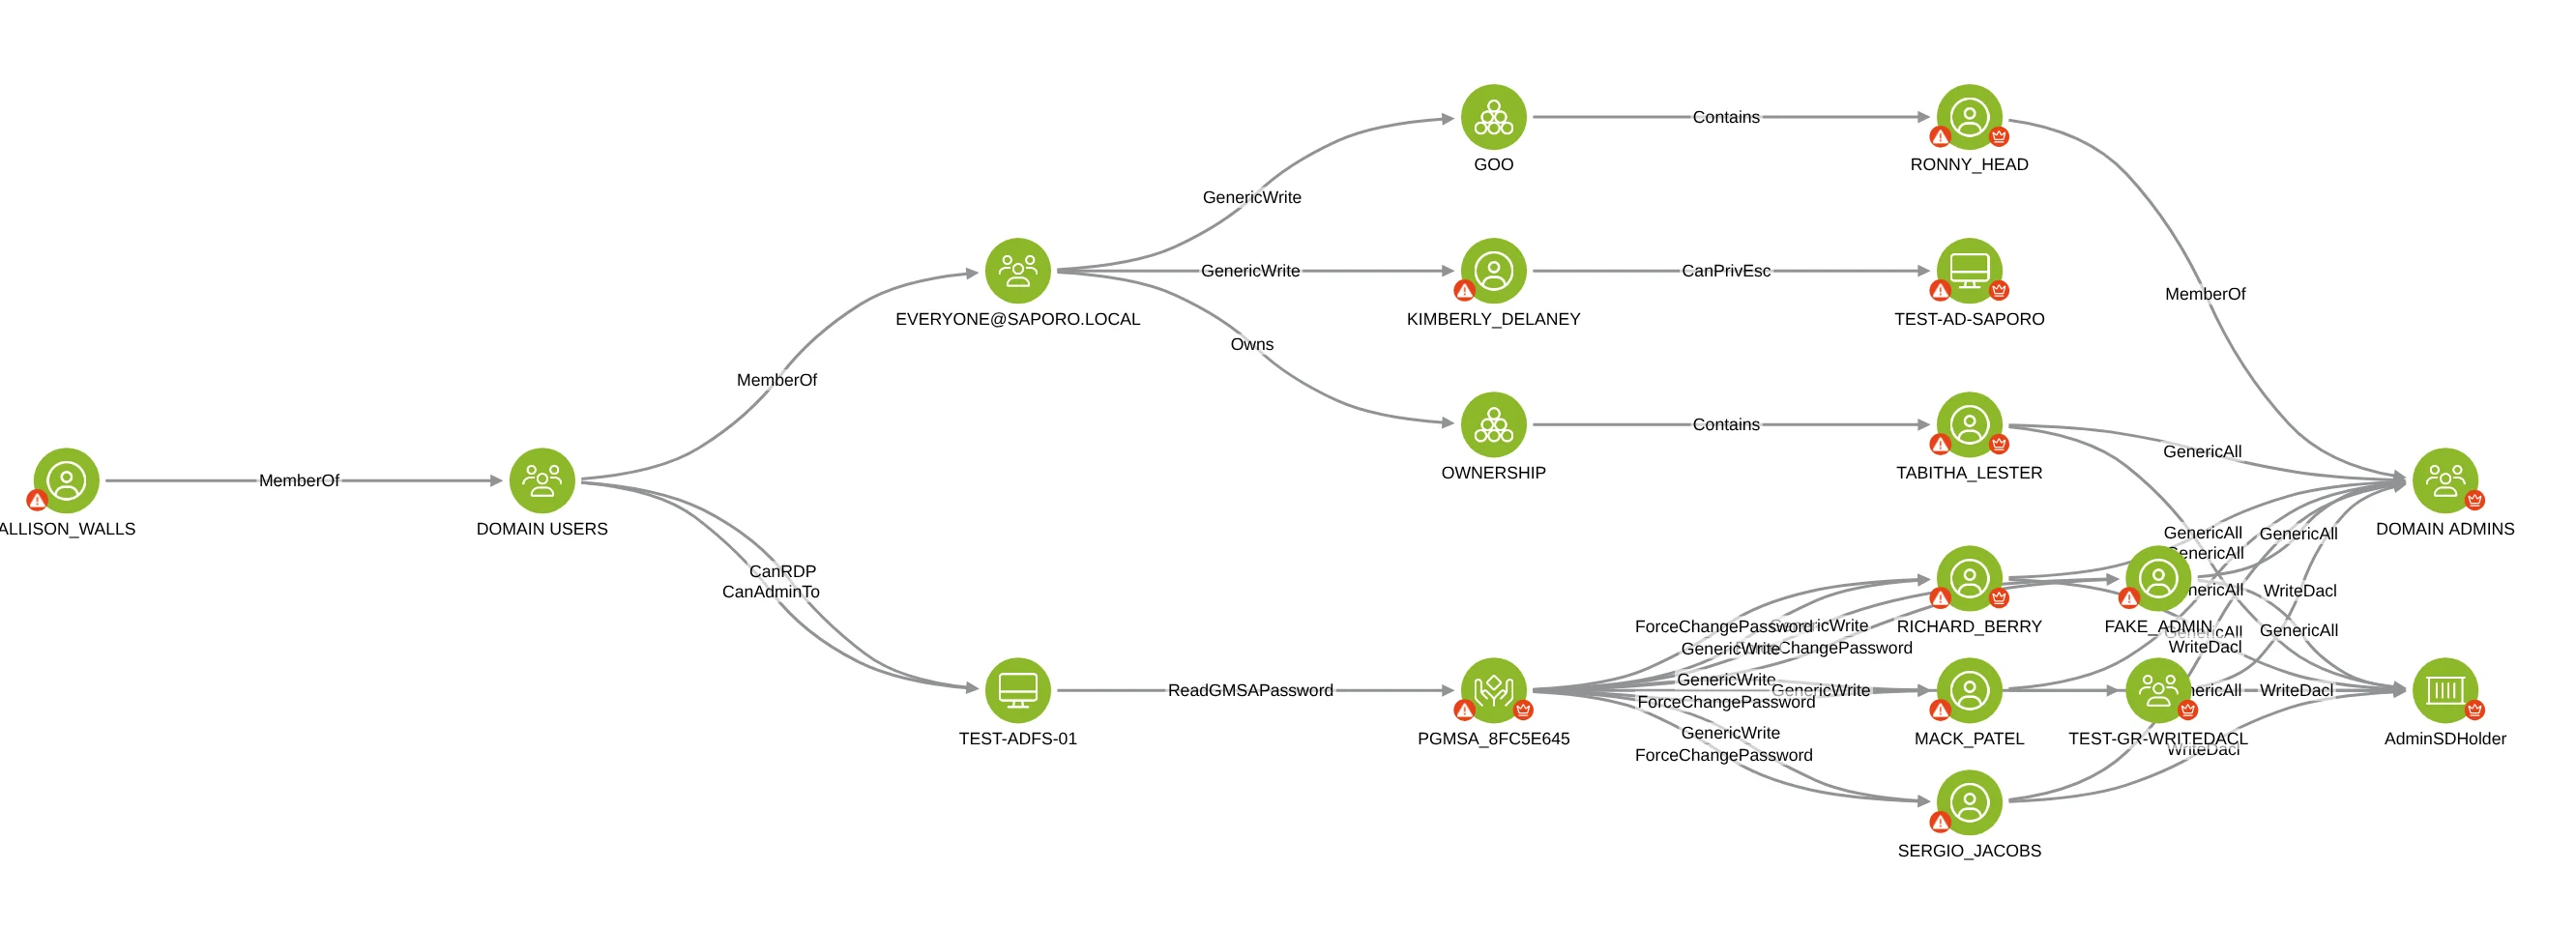
Saporo identity graph showing how users, groups, a server and a gMSA service account connect to Domain Admins, in an example environment
Inventory
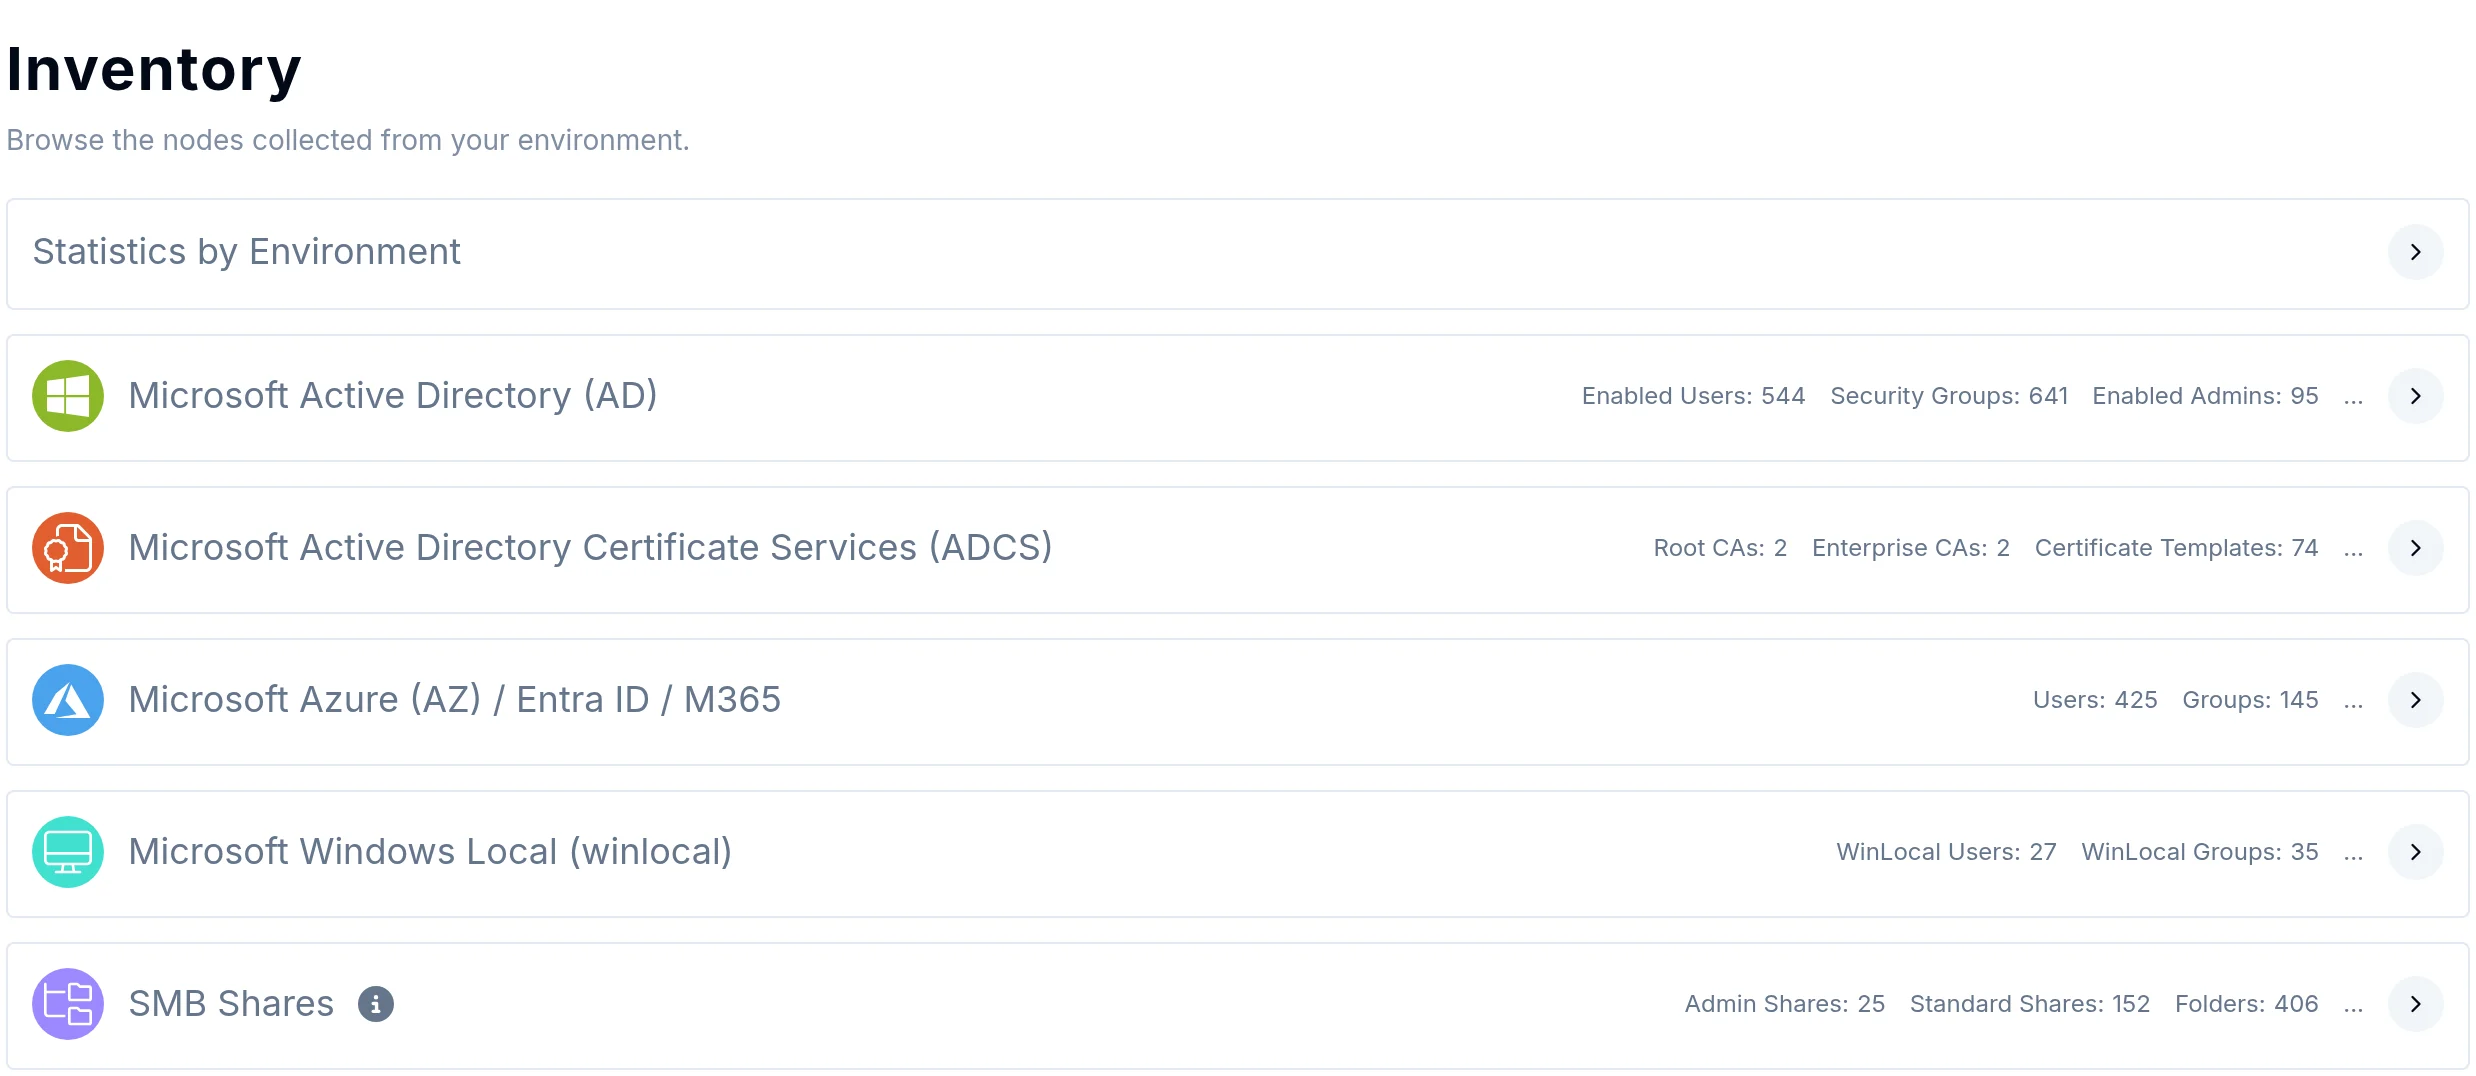
Saporo Inventory listing the nodes collected from Microsoft Active Directory, Active Directory Certificate Services, Azure, Entra ID and Microsoft 365, Windows Local, and SMB Shares, with counts for each source, in an example environment

Many environments, one platform

Connect your on-premises and cloud data sources. Explore their identities, permissions, resources, and relationships in one graph.

Saporo Inventory listing the nodes collected from Microsoft Active Directory, Active Directory Certificate Services, Azure, Entra ID and Microsoft 365, Windows Local, and SMB Shares, with counts for each source, in an example environment
Inventory / Connected sourcesExample environment and data.

One platform for identity exposure

Separate tools and consoles make access across environments harder to understand. Saporo connects everything in one graph, giving teams a shared view of exposure.

The fragmented way

  • Separate inventories for each data source
  • Access across environments difficult to reconstruct
  • Human and non-human identities reviewed separately
  • Different teams working from separate information

With Saporo

  • One inventory and graph across connected sources
  • Hybrid access relationships and attack paths in one graph
  • Human & non-human identities in the same exposure model
  • One shared view for IAM, security, and cloud teams

No more blind spots, no more isolated results

With identities and relationships connected in one model, your teams can answer questions without piecing together results from several tools.

On-premises and cloud in one model

See identities and resources from your connected data sources in one inventory. Explore their permissions and relationships without switching between separate consoles.
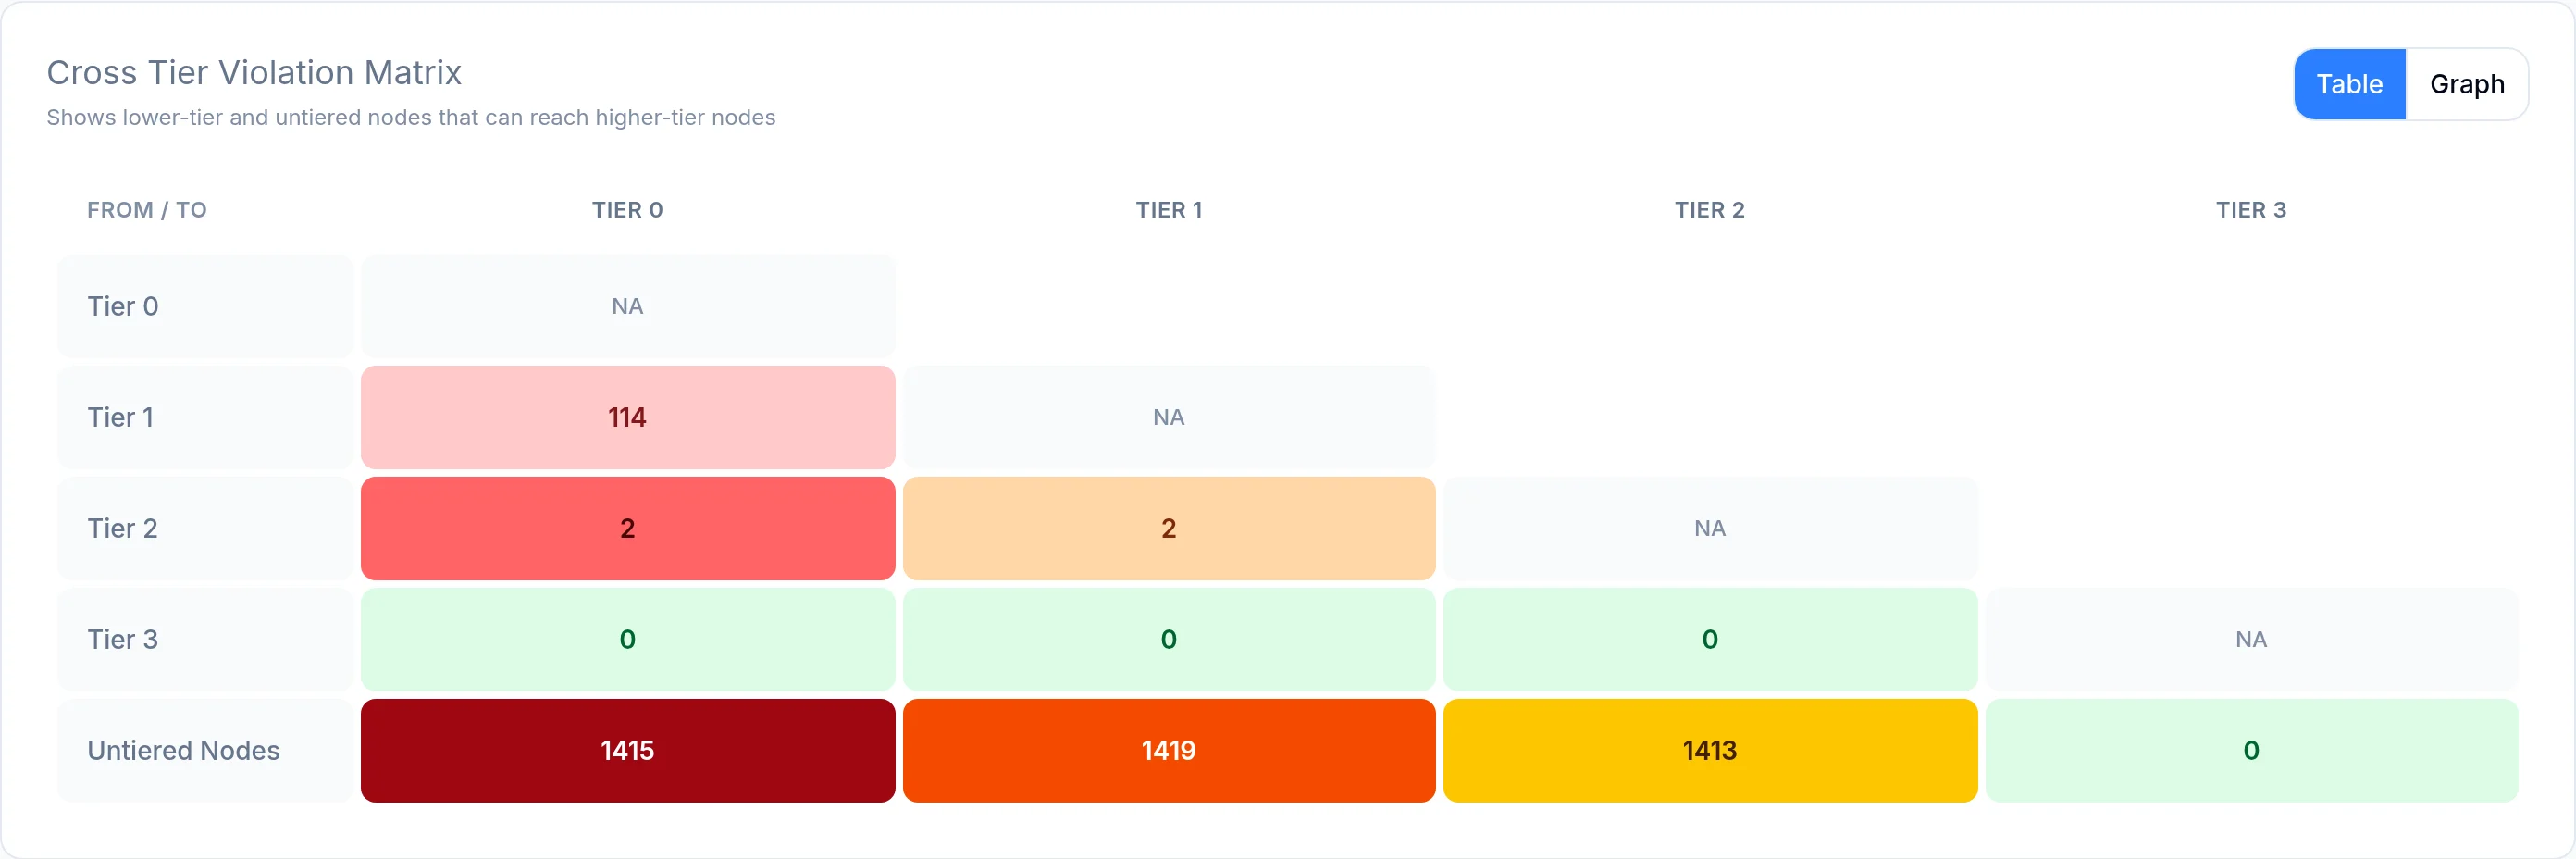
Saporo Cross Tier Violation Matrix showing how many lower-tier and untiered nodes can reach higher-tier nodes, in an example environment
Tiering / Cross-tier violation matrixExample environment and data.

Human and non-human identities together

Review human and non-human identities together, with the permissions they hold, the relationships that could expose them, and the resources they can reach.
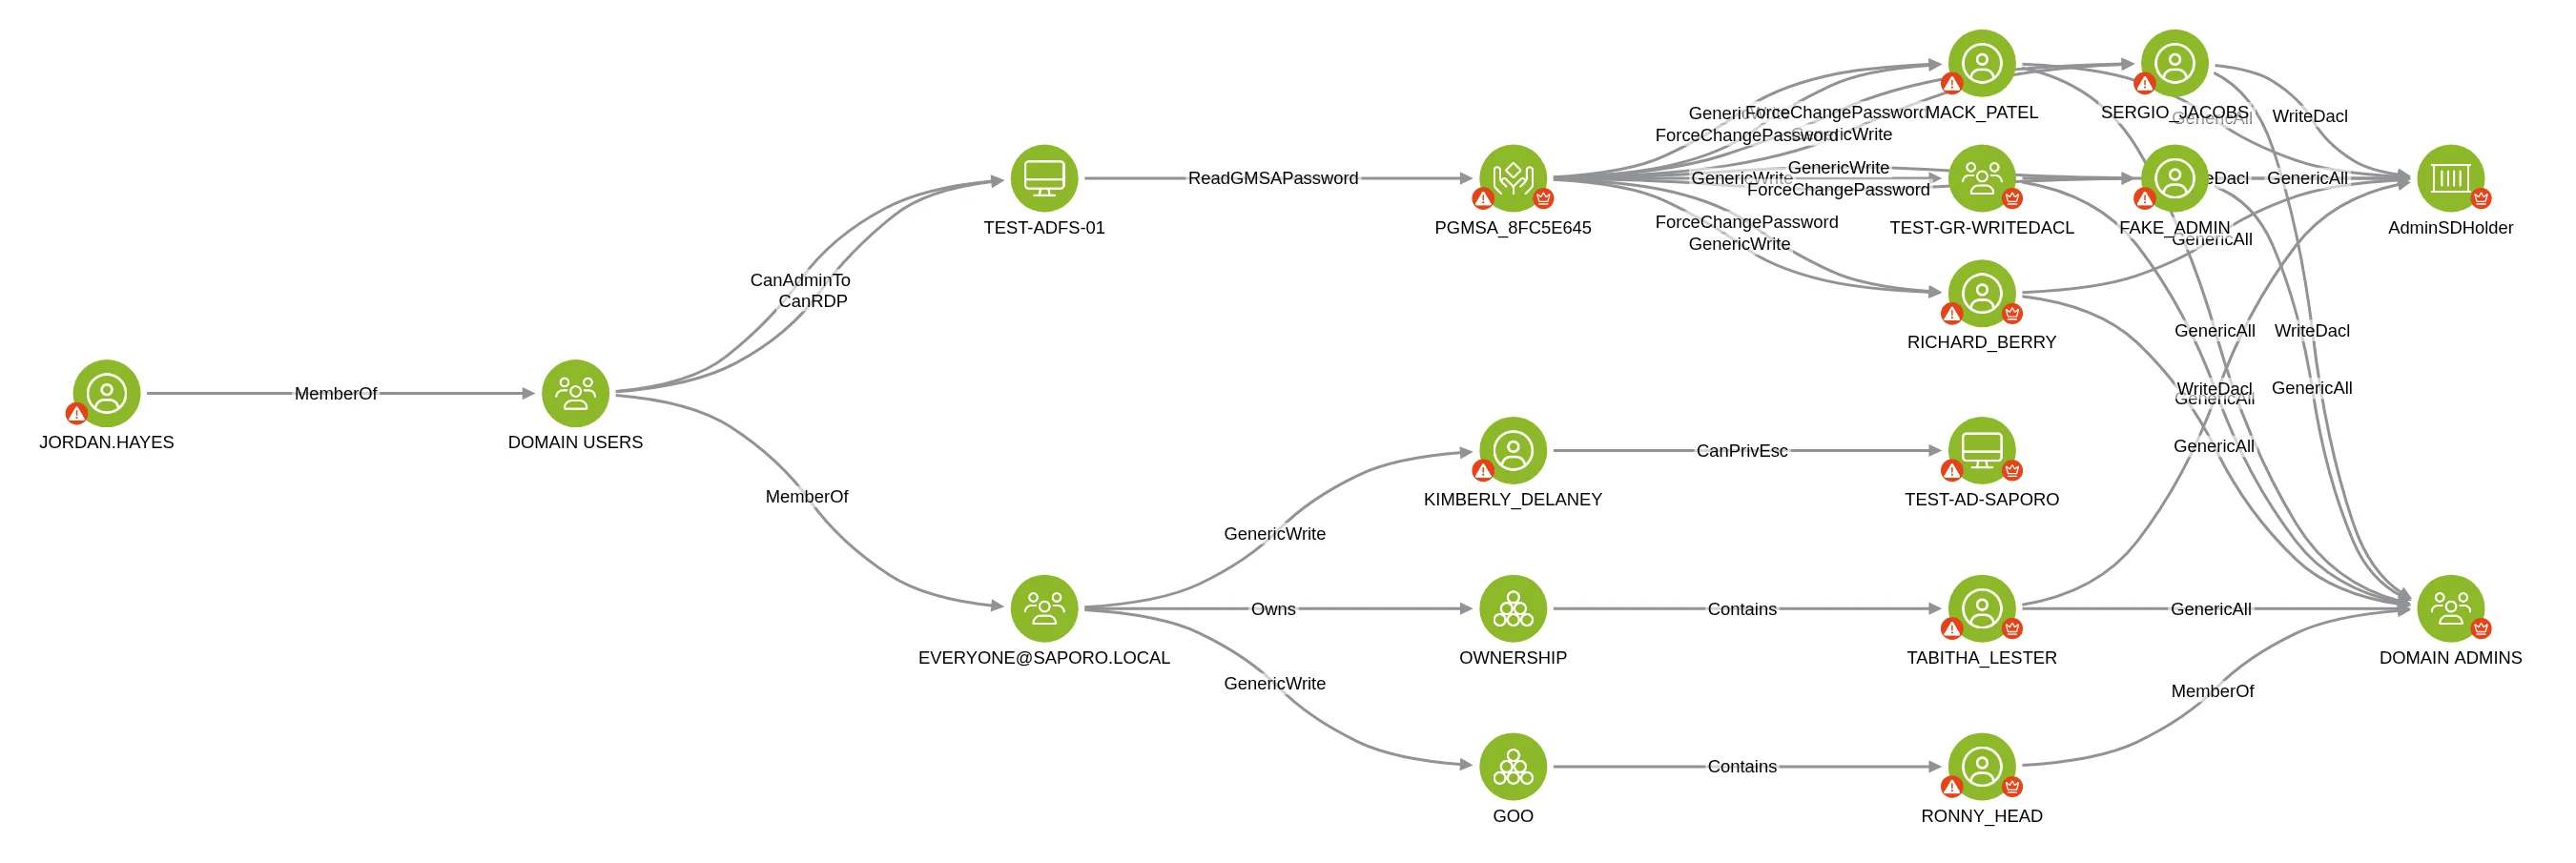
Saporo Explore graph showing how a standard user can reach Domain Admins through group membership, local admin access to a server, a readable gMSA password, and ACL permissions, in an example environment
Explore / Identity graphExample environment and data.

Hybrid attack and access paths

Follow attack and access paths across connected environments in one graph. Understand how permissions and relationships could let an attacker move between systems and reach critical assets.
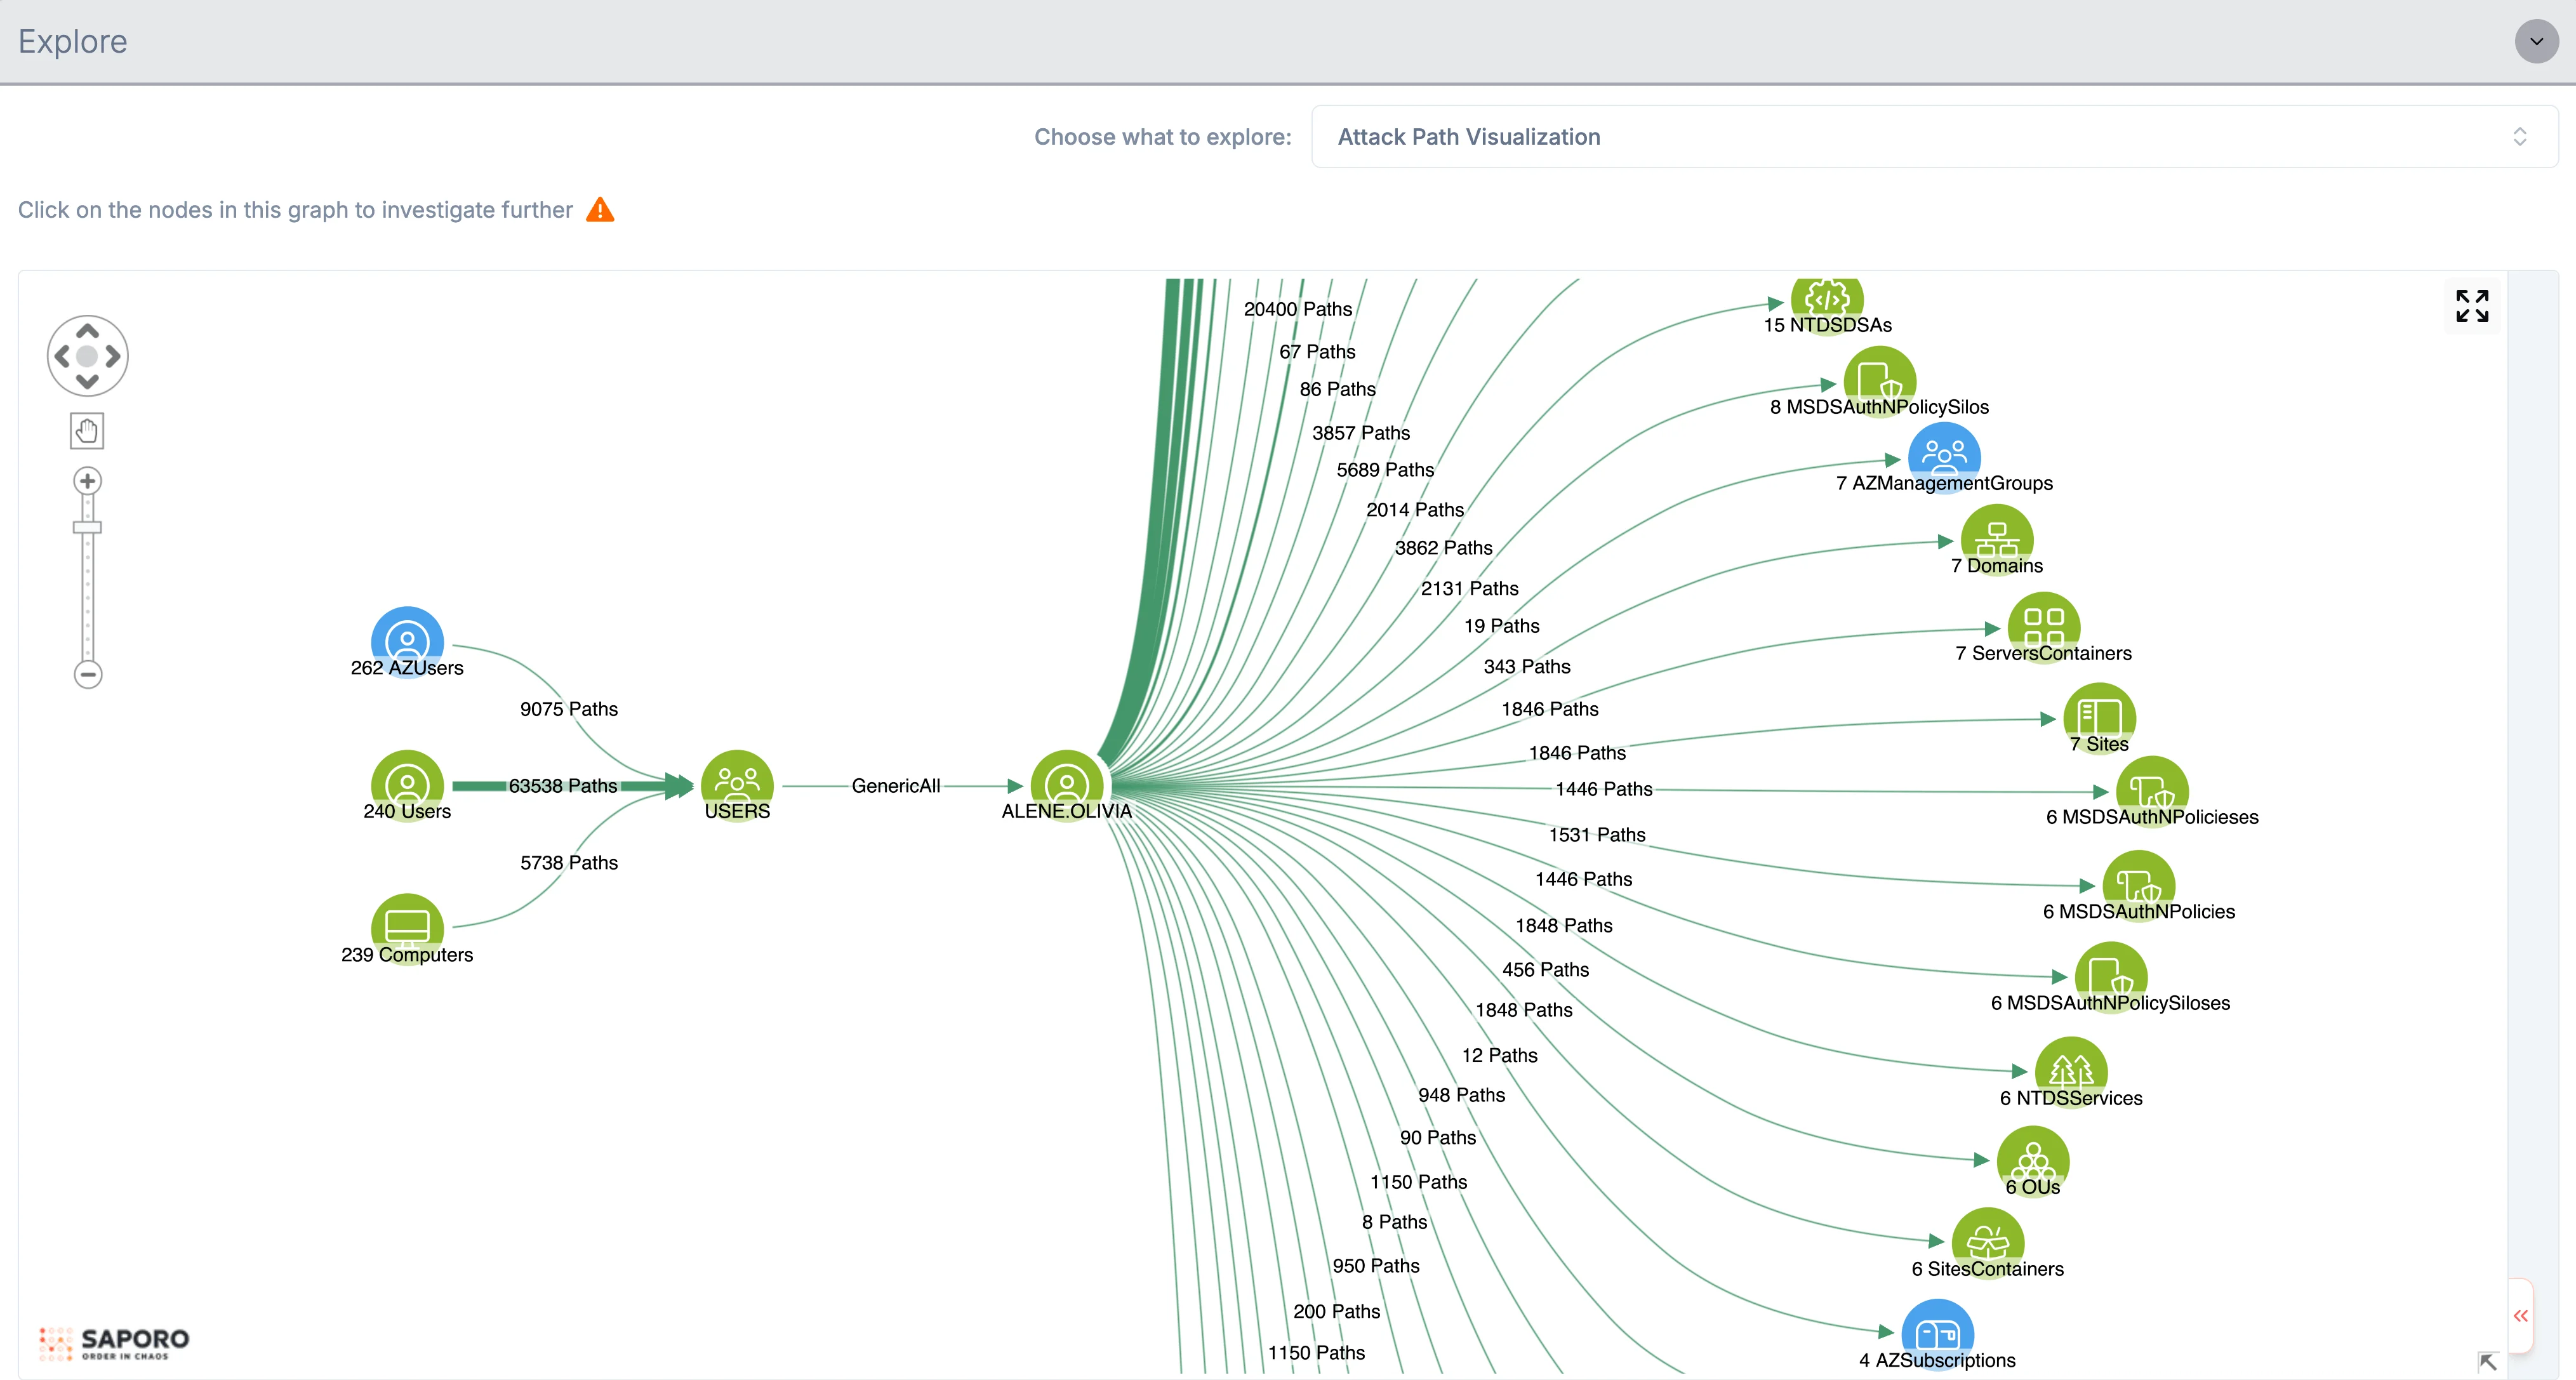
Saporo attack path visualization where 240 users, 262 Azure users and 239 computers reach the USERS group through thousands of paths, which holds GenericAll over ALENE.OLIVIA, a chokepoint that fans out to domains, sites, OUs, authentication policies and Azure subscriptions, in an example environment
Explore / Attack path visualizationExample environment and data.

One place to act

Investigate findings and resolve issues with remediation guidance and automated workflows. Give IAM, security, and cloud teams one place to coordinate changes and track progress.
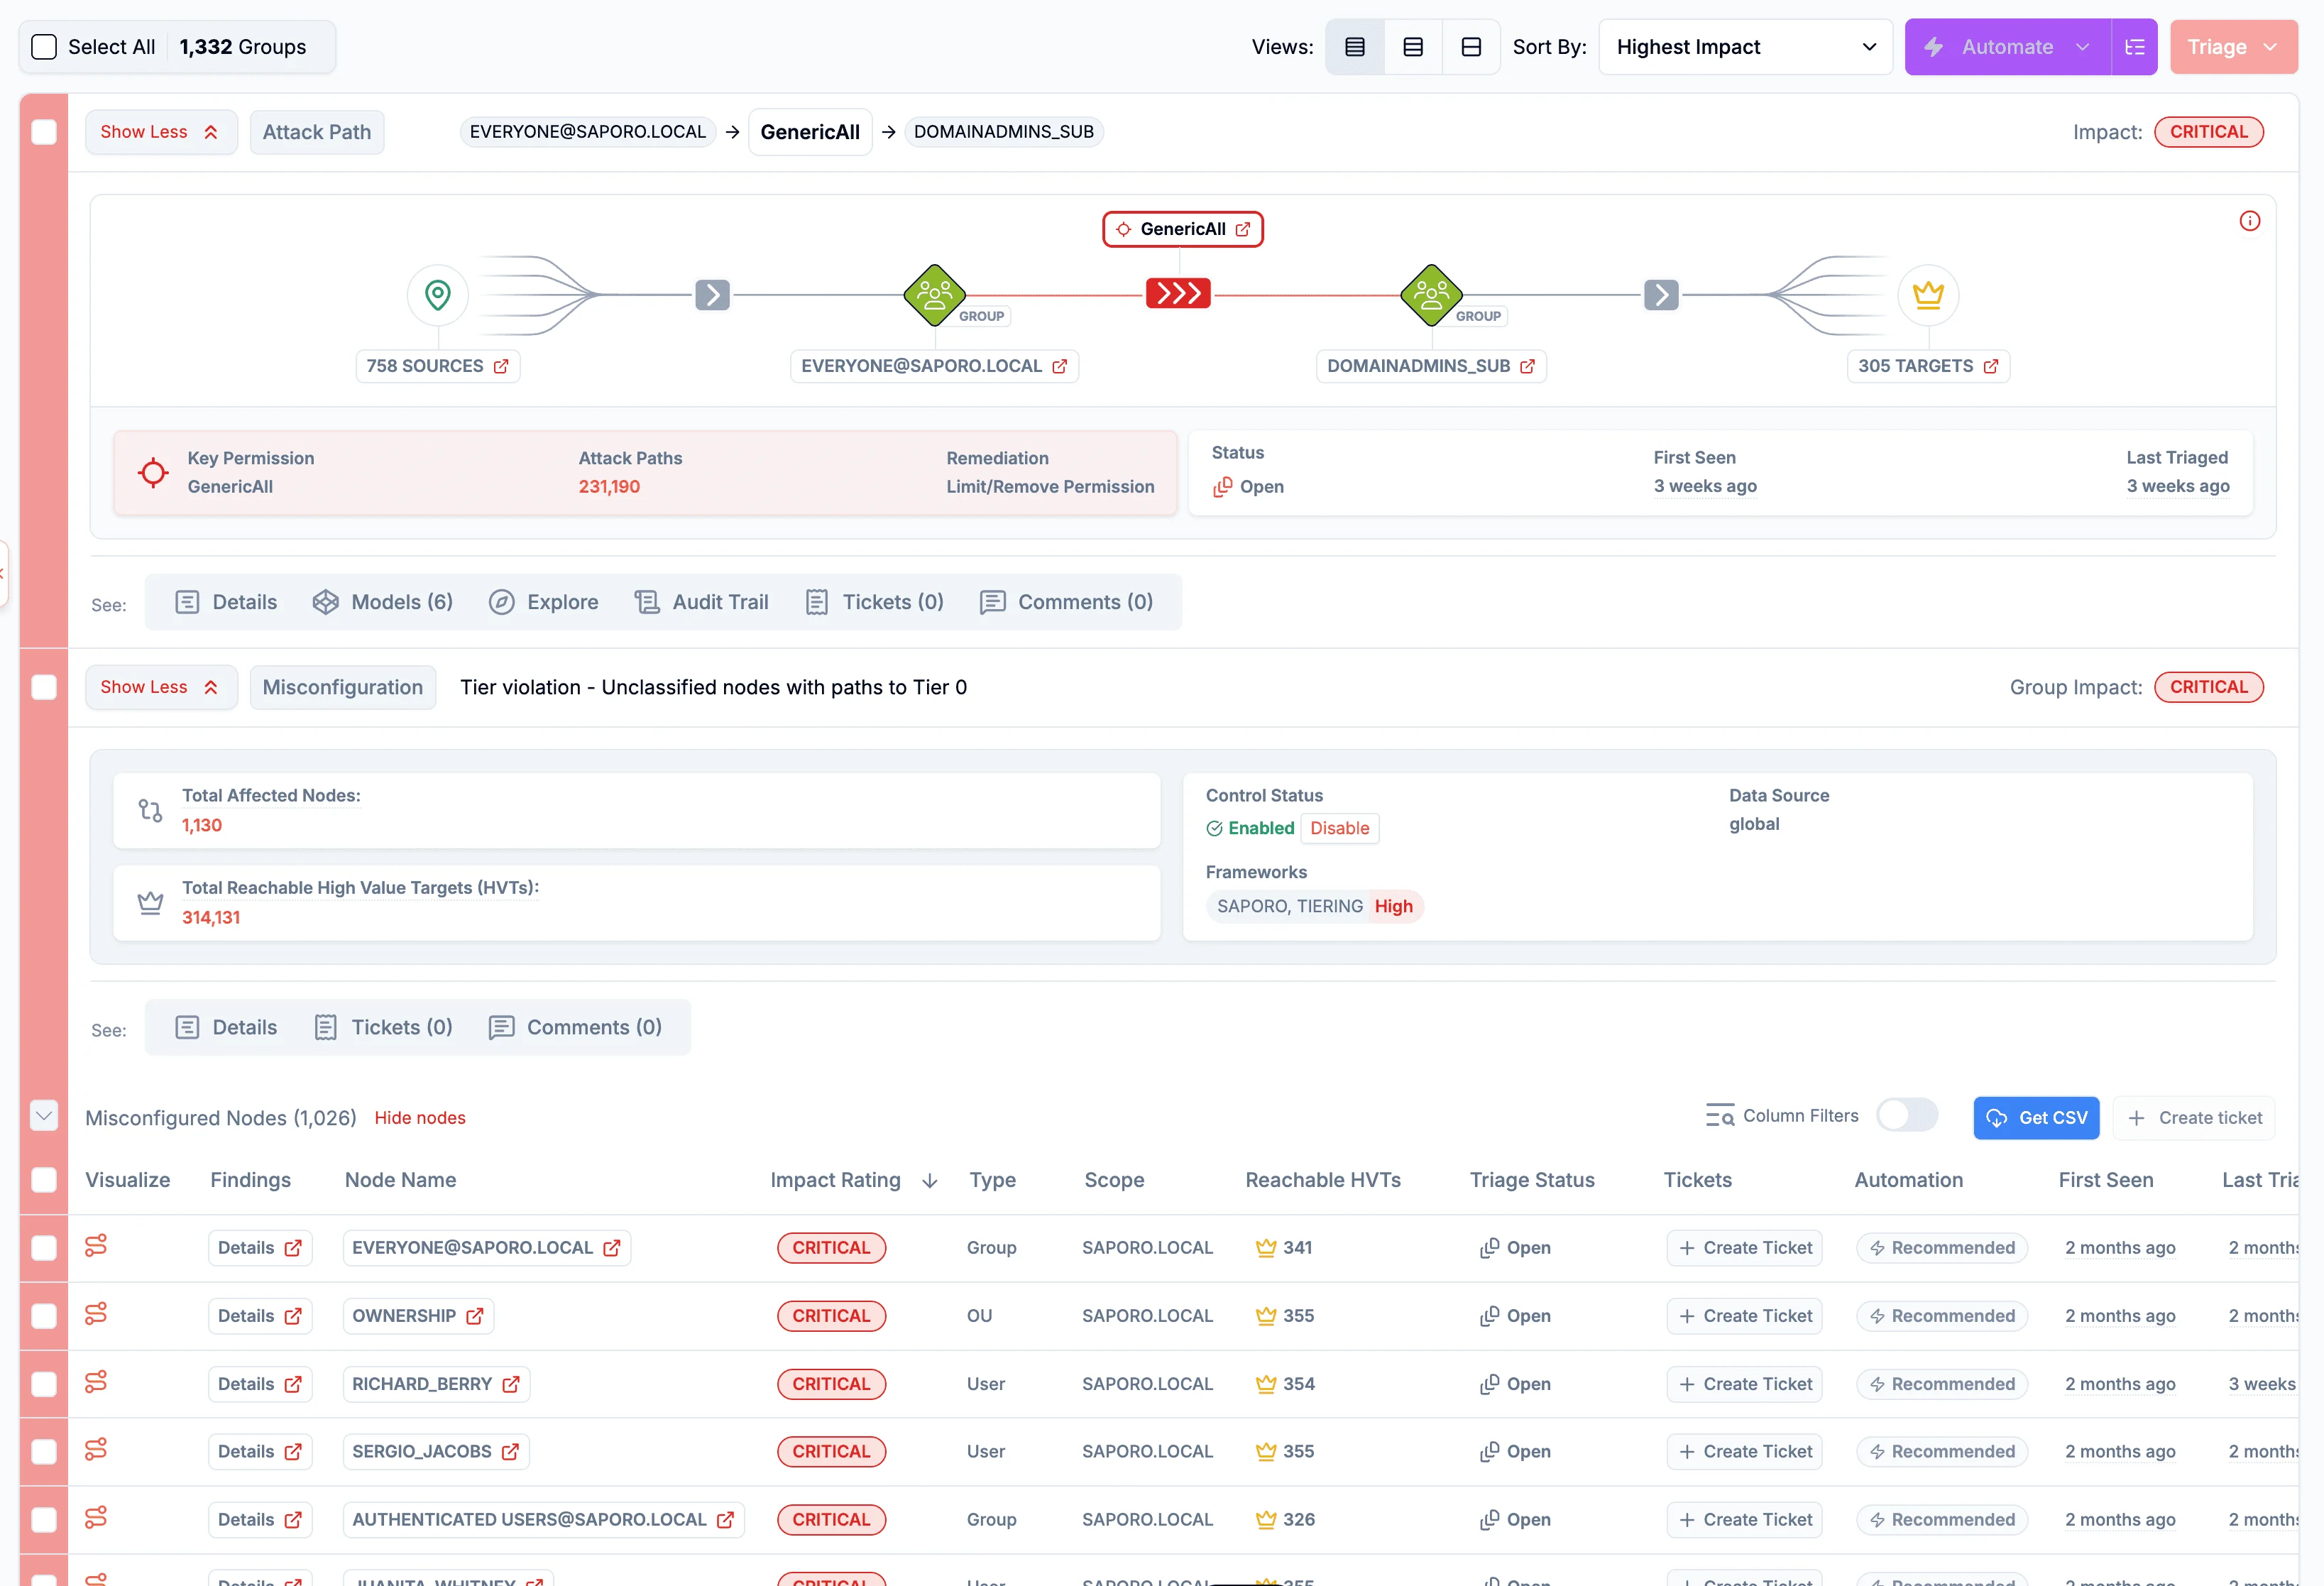
Saporo attack path finding from EVERYONE@SAPORO.LOCAL through a GenericAll permission to DOMAINADMINS_SUB, showing the key permission, attack path count, recommended remediation, and open status, in an example environment
Findings / Attack pathExample environment and data.

Unified Identity Visibility Q&A

What teams ask about unified identity visibility

Saporo connects on-premises and cloud data sources in one graph: Active Directory, AD Certificate Services, Windows Local, SMB shares, Entra ID, Azure, Microsoft 365, Google Workspace, Google Cloud, and AWS.

Yes. Saporo brings human and non-human identities, including user accounts and service accounts, into the same inventory and graph. You can investigate their permissions and access to resources together.

Saporo shows attack and access paths between connected cloud and on-premises environments. You can investigate the permissions and identity relationships that make those paths possible.

No. Instead of reviewing each source in its own console, your teams query one graph across every connected source and see how access in one environment reaches assets in another.

IAM, security, infrastructure, and cloud teams share one view of identity risk, ownership, priorities, and remediation progress. Each team owns its scope, and fixes no longer stall when a path crosses team boundaries.

See every identity and path in one graph

Book a demo