Our Journey to Counting A Billion Attack Paths In 7 Minutes


Our Journey to Counting A Billion Attack Paths In 7 Minutes
One question, at enormous scale.
At the heart of Saporo sits our chokepoint engine. Its sole purpose is to help our customers answer one question, at enormous scale: from every identity, across every shortest attack path, which permissions could grant an adversary the highest degree of control over their most critical assets? We call those permissions chokepoints, and they are where a defender's effort pays off best. Severing one cuts every attack path that runs through it, so ranking chokepoints well is the difference between chipping away at findings one at a time and collapsing thousands of attack paths with a single fix.
Chokepoints exist because an attacker does not so much break into an identity environment as walk through it. The graph that ties users, computers, service accounts, and cloud identities together through group memberships, permissions, delegations, and trusts is astonishingly connected, but the routes through it are not spread evenly. They funnel, and finding where they funnel feeds directly into how our customers prioritize their work, which is a polite way of saying the numbers have to be right.
Saporo’s existing engine already did this using an in-memory graph across hundreds of thousands of identities and millions of relationships, a scale that conventional disk-based graph approaches struggle to analyze in full. Numbers that drive customer priorities deserve independent verification, and that is where this story starts.
To validate the analysis, I built a second implementation from end to end on a completely different computational model. It was never meant to ship, its only job was to independently audit the production engine. On the benchmark environment, it produced materially different results from the production implementation. Rather than treat either result as definitive, I turned to the raw graph for independent verification.
The raw graph would referee.
The query that took all afternoon
For narrow, specific claims, you can force the graph to tell you the truth. How many identities can genuinely reach a high value target? That is a question a patient, brute force query can grind out, with none of either engine's machinery involved. So, I wrote those queries and let them run, and the answers they produced would become the ground truth.
The reachability check alone took nearly fourteen minutes to count identities that could access high value targets. The full path count I started in the morning and checked on for the rest of the day. When it finally came back, many hours later, the count of shortest attack paths in this one environment was just under a billion.
One rule applies to every number in this story. Paths are only counted up to a fixed number of steps. Not because a long path is safe - an attacker who needs twelve hops will take twelve hops - but because identity environments are so densely connected that almost every identity and target that shows up at all already shows up within a few hops. Performing a deeper search mostly multiplies the number of routes between the same identities and targets, rather than materially expanding who can reach what.
The ground truth also confirmed something that surprised even us. About 96 percent of the identities in this environment can reach at least one high value target within that same hop-budget. Not a specialized subset of admins and service accounts, but nearly every identity. In reality, identity environments simply are this connected, and that connectivity is exactly what makes this analysis matter and exactly what makes it difficult.
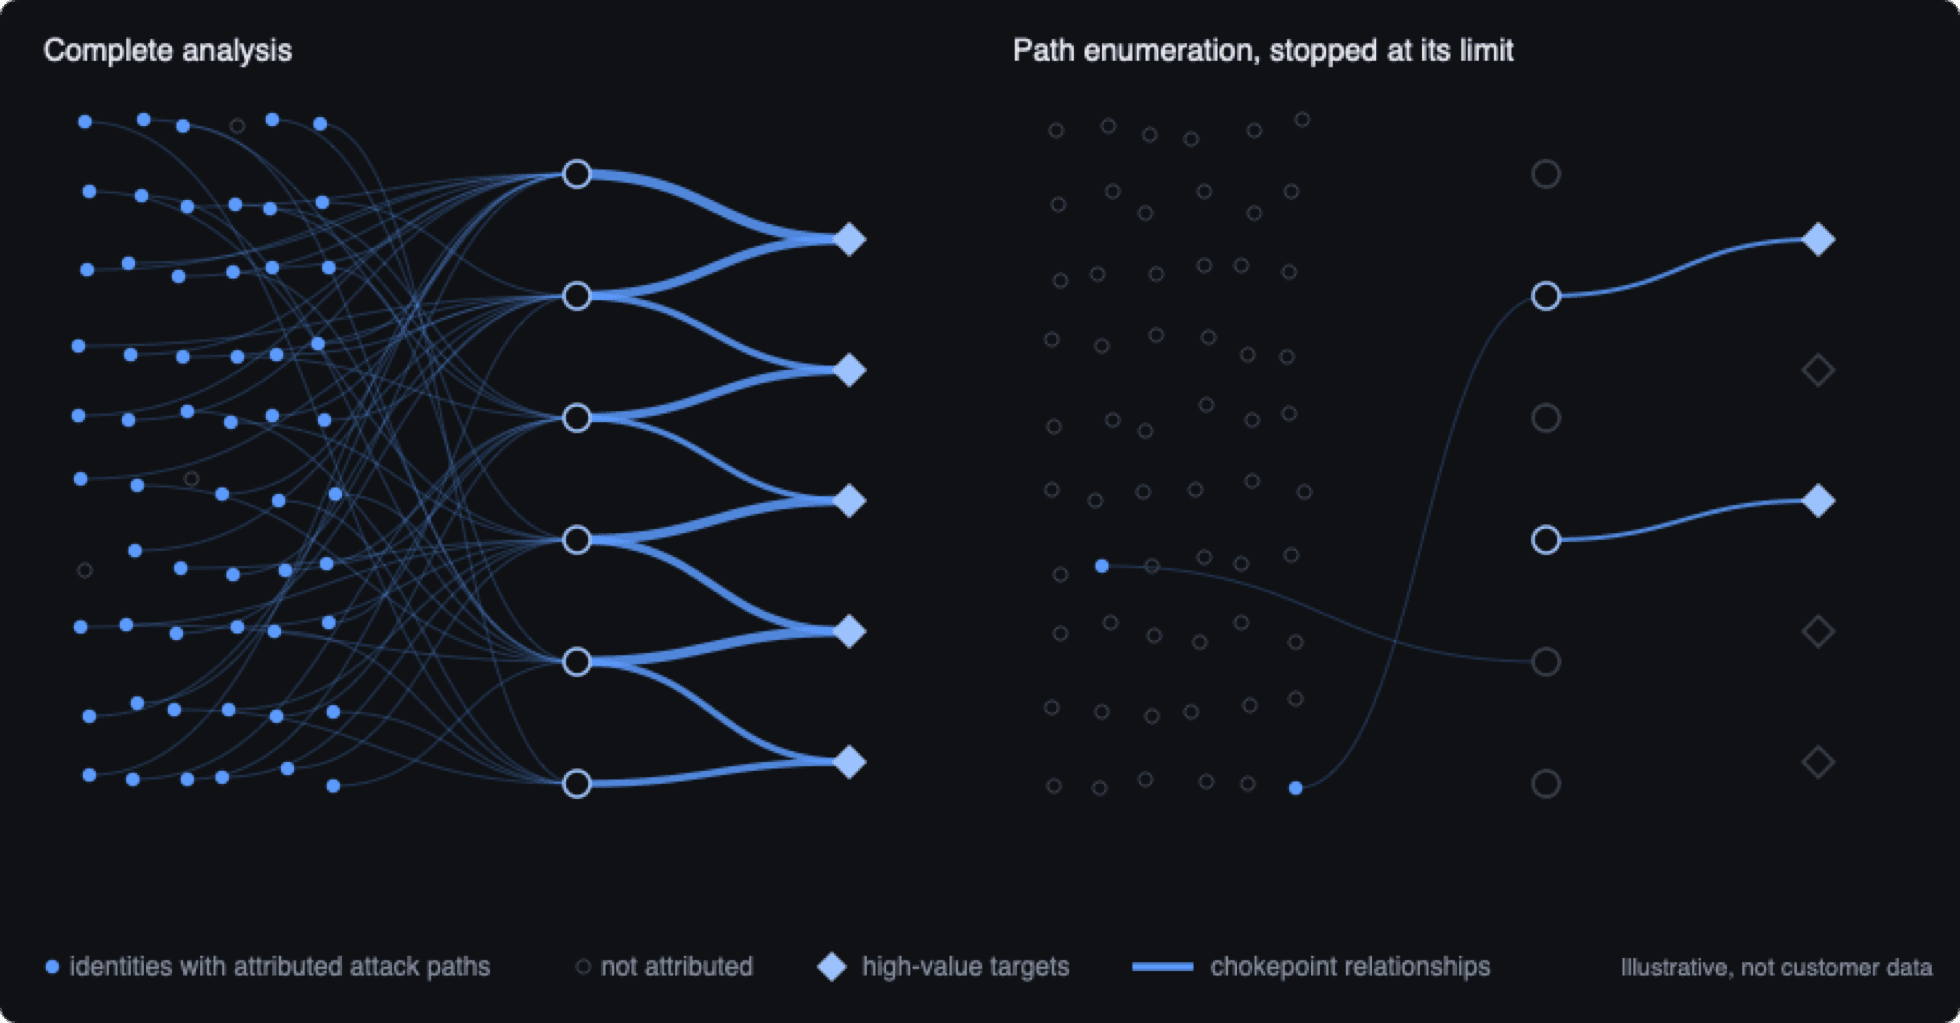
The ground-truth queries matched the audit engine and showed that the production engine had reached a boundary built into its path-enumeration approach. This was not a bug. It was an intentional design trade-off that had made large-scale chokepoint analysis practical before a non-enumerating alternative existed.
The law of physics that wasn’t
The production engine answered the chokepoint question in the most direct way: ask our in-memory graph database for the paths, then compute statistics on what comes back. That approach already allowed Saporo to perform chokepoint analysis at a scale few platforms can match.
But as I had now seen, a real enterprise environment can contain close to (and probably more than) a billion shortest attack paths. No path-enumerating engine can retain all of those in memory, so the production engine used a deliberate cap as a safety guardrail. It preserved complete results on environments below the cap while making the analysis practical on much larger ones. The cap had been part of the architecture for so long that it began to feel less like a design choice and more like a law of physics: enterprise-scale chokepoint analysis required choosing how many paths to retain.
The audit engine gave me a reason to revisit that assumption. On the largest graphs, the original engine still delivered actionable rankings, but those rankings were necessarily based on the paths retained within the cap. What we wanted next was complete coverage without giving up the scale and performance the existing engine had already achieved.
My first instinct was to extend the approach that had served us well: raise the limit, tune the query, or give it more memory. But the math pointed elsewhere. Covering this environment through enumeration would require terabytes of intermediate data to produce statistics that ultimately fit in a few megabytes. A billion paths repeatedly traverse the same relationships, while everything the analysis reports lives on roughly thirty thousand of them.
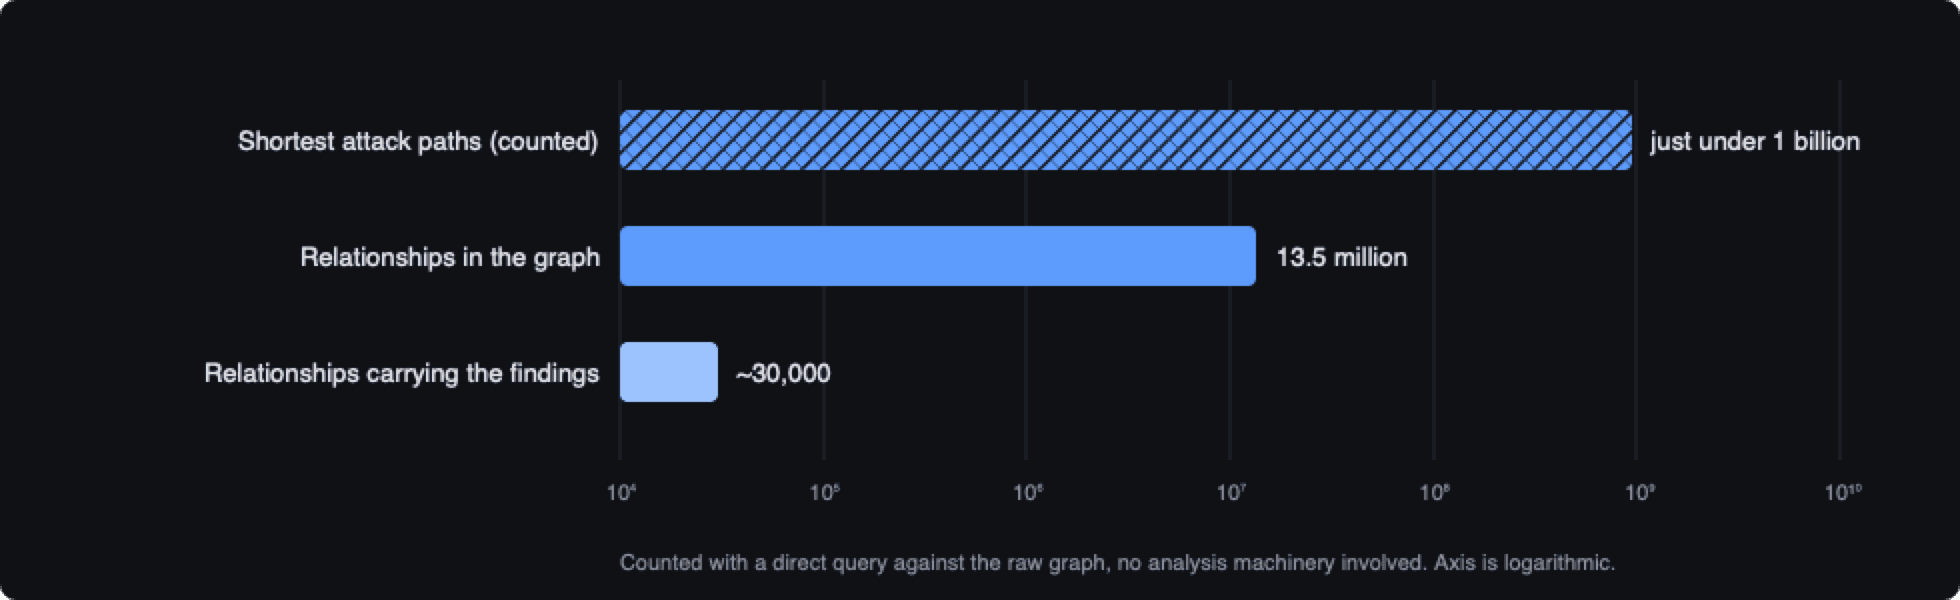
The law was not that exact analysis at this scale was impossible. It was that exact analysis was impossible if every path first had to be written down.
Standing on the bridge
The way out was a change of perspective, rather than a bigger budget. If you want to know which bridge carries the most traffic in a city, you do not follow every car through its journey and then read back through millions of recorded routes. You stand on the bridge and count. Our analysis had been writing down routes, when everything it needed can be measured from the bridge itself: how often each relationship appears on shortest attack paths, how many identities rely on it, how many high value targets sit behind it. The paths were never the product. They were an intermediate representation, and an increasingly expensive one at enterprise scale.
Standing on the bridge and counting is how the audit engine had worked from the start. Instead of retaining every route, it accumulated the same information directly on the relationships the routes crossed. Its memory requirements followed the size of the graph, not the vastly larger number of paths through it. This allowed it to account for every shortest path within the analysis budget.
The idea is not ours; graph theory has been counting shortest paths without materializing them since Brandes' algorithm in 2001. The real work was making it survive enterprise identity data, with its path costs, hop limits, several identity systems, and every count tied back to the specific identities and permissions behind it. That part we are keeping to ourselves.
So we gave the audit engine a promotion. The tool built to independently verify our production results became the core of the new v5 engine: same customer-facing metrics, same definitions, and every shortest path within the analysis budget accounted for. What had appeared to be an unavoidable limit at this scale turned out to be an opportunity to change the computational model.
Earning the word “exact”
Promoting the audit engine created a vacancy, because the engine that had been checking our numbers was now the one producing them. And exact numbers demand more scrutiny, not less. While performance is immediately visible, correctness requires deliberate verification. A plausible result is not, by itself, proof of an exact one. Calling a result exact raises the standard of proof. The new engine needed several independent ways to demonstrate that exactness across both constructed test cases and real enterprise graphs.
The two engines then swapped roles. The previous implementation stayed in the codebase as an independent witness, with randomized graphs run through both and their outputs required to match whenever the complete path set fit below the cap. Counts match exactly, down to the last path, while fractional sums receive a small floating-point tolerance (because in floating point arithmetic 0.1 plus 0.2 is only mostly 0.3). And the raw graph kept the final say throughout. That additional check mattered because some edge cases only emerged when the engine was tested against full-scale enterprise data.
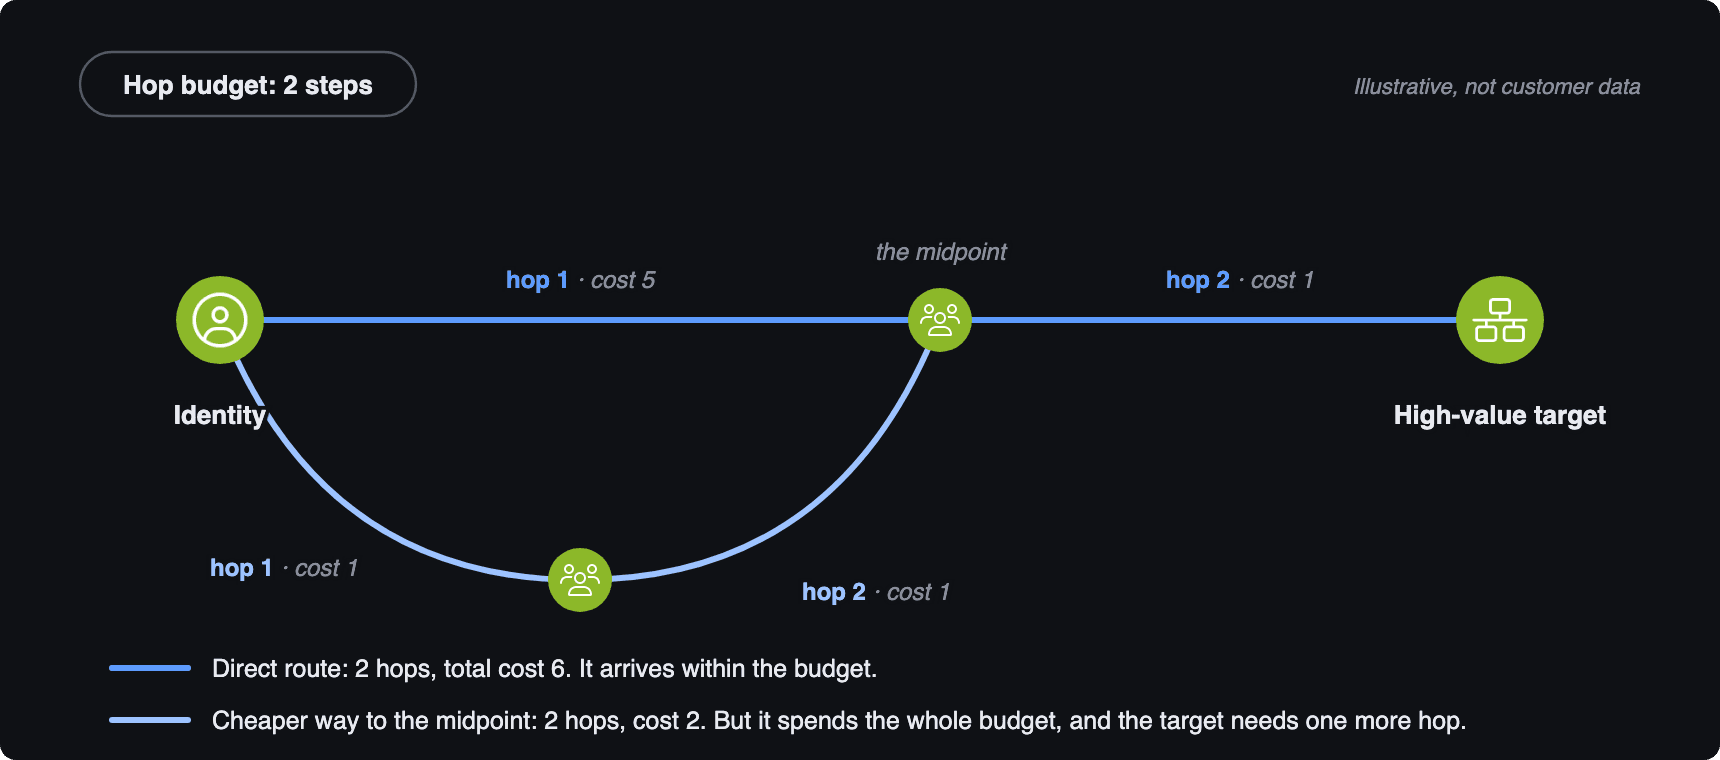
The one that taught me the most came from the way we model attack paths. Saporo weighs every step by cost and bounds every path by hops, and the two interact in a way textbook shortest-path algorithms do not anticipate. Under a hop budget, the cheapest way to reach a midpoint is not always part of the cheapest way through it, because the cheaper route can spend too many steps getting there. Path enumeration gets this right for free, since it only ever scores complete paths; a counting engine has to get it right deliberately. My early model borrowed the textbook assumption instead. It agreed with every graph I constructed to test it, and produced a discrepancy only when it met a real environment at scale.
Production data received the same treatment. On a customer environment small enough that the previous engine never reached its cap, the new engine reproduced the existing score exactly. That is the compatibility standard: where the previous approach had complete coverage, the answer remains unchanged; on the largest environments, v5 extends that coverage to the full set of paths within budget.
The engine ships behind a switch, with the previous implementation retained as a fallback. Customers with very large environments may see some rankings move. This is not because the definition of a chokepoint has changed, but because the same analysis can now consider the complete picture.
Making exactness fast
Exactness was only the first milestone. The engine also had to be affordable to run. Its first complete execution took 84 minutes on a benchmark graph containing 10.4 million relationships. Three weeks of engineering later, the full analysis completed in 7.4 minutes, even though the graph had grown to 13.5 million relationships.
The performance gain came from the same principle as the correctness gain: do less unnecessary work. Instead of materializing paths, repeating graph copies, and performing separate searches for identities with identical access, the engine shares and consolidates the work while preserving the same result. It also helps that the engine runs where the data lives. We build our graph in Memgraph, an in-memory graph database that lets us load the engine as a custom module. The analysis begins with the full graph already in memory and no time is spent moving data before the real work starts.
Over the next several weeks, I worked through successive performance iterations, and my intuition often proved more obstacle than help. For example, a change I was sure of, removing a sorting step, benchmarked slower on the first run and identical on the second; it had done nothing, and the first benchmark was just noise. The development graphs misled me as well, hiding a setup step that consumed fifteen percent of the runtime on the real environment. The largest wins turned out to be the least glamorous ones, separate analysis passes repeating the same work until I made them share it. One change cut the runtime by nearly a third, and the next cut what remained in half.
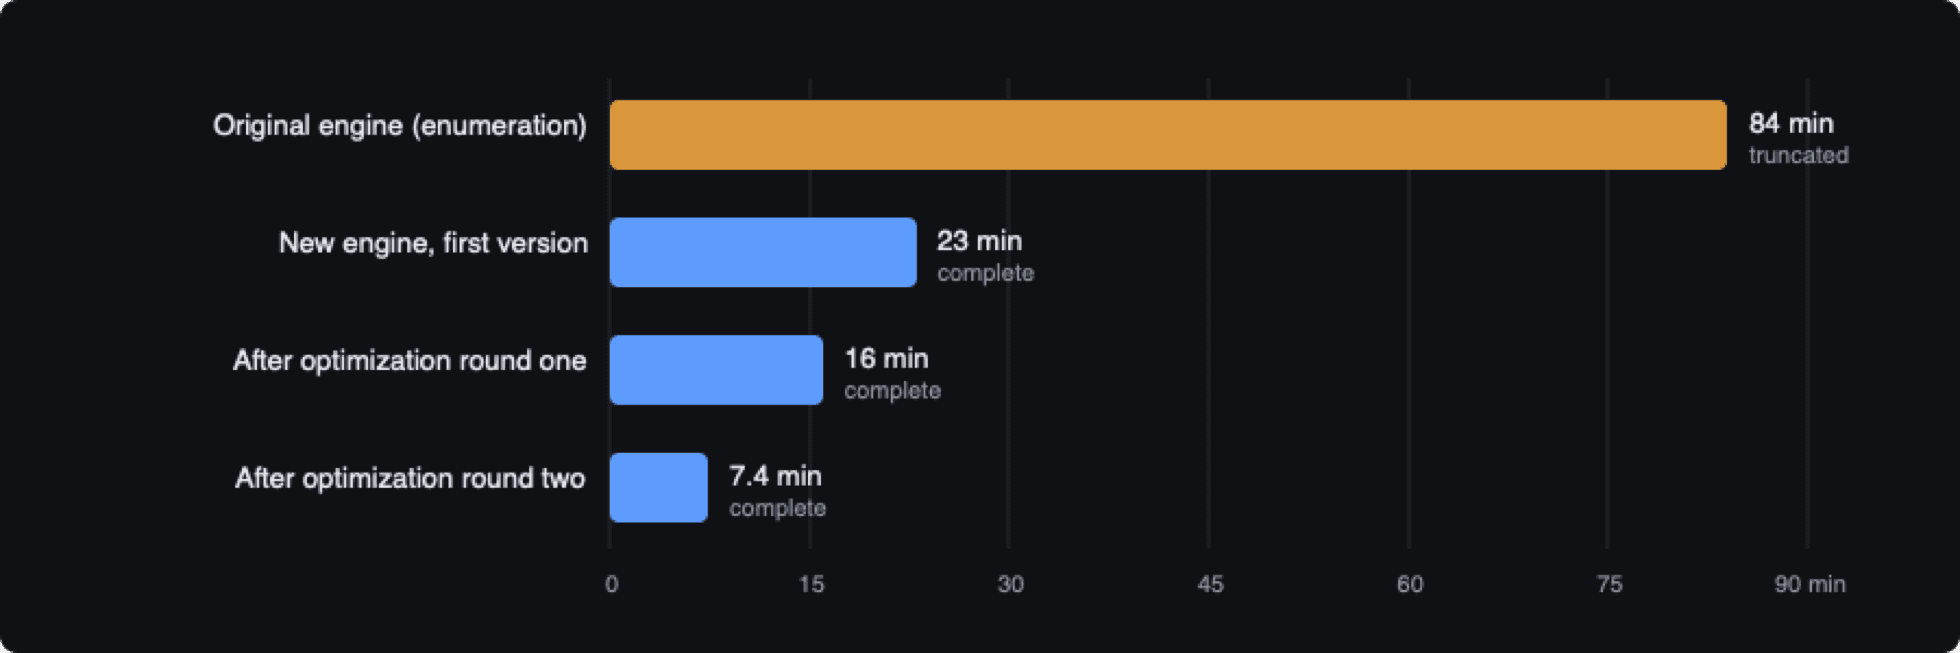
The benchmark analysis now completes in a little over seven minutes: roughly 320,000 nodes, 13.5 million relationships, and every shortest path within the analysis budget accounted for. The notable result is not merely that v5 is exact. It is that completeness and performance now reinforce one another.
Why this matters
Much of the attention in identity security goes to the graph itself: which identity systems can be connected, and how many millions of nodes and relationships can be represented. That foundation matters. Saporo chose an in-memory graph precisely because enterprise identity analysis demands both scale and speed.
The harder step is turning that graph into a short, trustworthy list of actions. Chokepoint analysis does this by identifying the permissions whose removal collapses the greatest number of attack paths to critical assets. Few platforms compute chokepoints at all, and fewer still do so across environments of this size. Saporo’s previous engine already made that possible.
V5 builds on that foundation. It accounts for every shortest attack path within the analysis budget, verifies the result through independent implementations and raw-graph checks, and completes the work faster than before. Customers no longer have to choose between enterprise scale, analytical completeness, and practical runtime.